
Halton Hills provides detailed information on its annual budgets, including business plans for various departments such as transportation, public works, and planning and development. The budget documents outline the town's financial strategies, capital expenditures, and operational costs, ensuring transparency and accountability in municipal spending.
About the Budget
The municipal budget is developed each year and includes:
- Operating Budget – Day‑to‑day services such as parks, fire services, roads maintenance and administration
- Capital Budget – Investments in infrastructure such as roads, facilities and equipment
Together, these budgets support the delivery of services residents rely on every day. The budget helps maintain essential services, investment in infrastructure and facilities, support for community programs and planning for future growth and needs.
How the Budget Is Developed
Budget development is an ongoing process that includes:
- Reviewing service needs and priorities
- Aligning with the Town’s strategic goals
- Planning for infrastructure and growth
- Considering financial sustainability and long‑term impacts
The budget is reviewed and approved by Council following discussion and input.
Visit the Let's Talk 2026 Budget Consultation page to learn more
| 2018 Capping Factors and options | Commercial | Industrial | Multi-residential |
|---|---|---|---|
Annualized Tax Limit | 10% | 10% | 10% |
Prior Year Tax Limit | 10% | 10% | 10% |
Clawback Percentage Retained | 100% | 100% | 100% |
CVA Threshold for Increasers | $500 | $500 | $500 |
CVA Threshold for Decreasers | $500 | $500 | $500 |
Municipal Levy Change Factor | 0.02466565 | 0.01419555 | 0.02307599 |
Exclude Properties Previously at CVA Tax | Yes | Yes | Yes |
Exclude Properties That Move From Capped to Clawed Back | Yes | Yes | Yes |
Exclude Properties That Move From Clawed Back to Capped | Yes | Yes | Yes |
Notional Rate Urban | 1.754748% | 2.760160% | 1.454412% |
Notional Rate Rural | 1.714617% | 2.695138% | 1.399306% |
Final Tax Rate Urban | 1.798030% | 2.799342% | 1.487974% |
Final Tax Rate Rural | 1.757737% | 2.734057% | 1.432646% |
| 2017 Capping Factors and options | Commercial | Industrial | Multi-residential |
|---|---|---|---|
Annualized Tax Limit | 10% | 10% | 10% |
Prior Year Tax Limit | 10% | 10% | 10% |
Clawback Percentage Retained | 76.2591% | 73.9263% | 100% |
CVA Threshold for Increasers | $500.00 | $500.00 | $500.00 |
CVA Threshold for Decreasers | $500.00 | $500.00 | $500.00 |
Municipal Levy Change Factor | 0.026823 | 0.0158484 | 0.02594164 |
Exclude Properties Previously at CVA Tax | Yes | Yes | Yes |
Exclude Properties That Move From Capped to Clawed Back | Yes | Yes | Yes |
Exclude Properties That Move From Clawed Back to Capped | Yes | Yes | Yes |
Notional Rate Urban | 1.799171% | 2.889250% | 1.495896% |
Notional Rate Rural | 1.756874% | 2.820718% | 1.437816% |
Final Tax Rate Urban | 1.847431% | 2.935040% | 1.534702% |
Final Tax Rate Rural | 1.805152% | 2.866537% | 1.476646% |
By-Law 2025-0104
2026 Rates & Fees
Review the current fees for Town services, recreation programs, facility rentals, permits, applications, and other municipal services.
Visit the 2026 Rates & Fees informationProperty Reassessment
How will reassessment affect my 2017-2020 taxes?
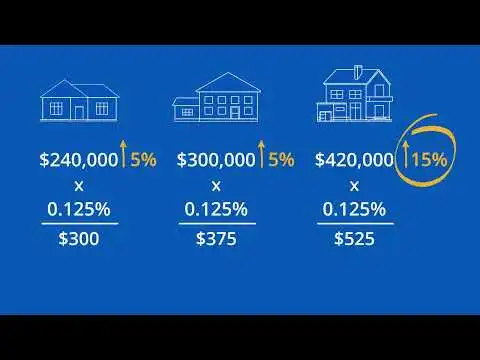
Halton Region has experienced higher market value increases than the province as a whole. Halton Hills' market value increases are approximately 25 per cent. If your assessment has increased by more than 25 per cent you will experience an assessment related increase in your taxes that will be phased-in over the four year period. For example:
2017 (old) market value — $600,000
2020 (new) market value — $850,000
Increase — $250,000
This example represents a 42 per cent increase or 10.5 per cent increase year over year from 2017 to 2020. The town's overall average increase is approximately 25 per cent or 6.3 per cent year over year. If your assessment has increased more than the Town's overall average, you will have a property tax increase due to reassessment. The difference between the average Town increase of 25 per cent and the increase of 42 per cent from the example above is 17 per cent. The 17 per cent difference will be phased-in over the four year period 2017 to 2020, or approximately 4.25 per cent increase per year (excluding any budgetary related changes). Please note that all percentages are estimates.